home
needs
local resources
comfort
safety & health
contact
reports
Wall effects
Two types of wall effects are present in a stove. One represents a heat loss through the wall to the outside environment and the other is a certain amount of radiant heat gain by the pan from the walls.
Heat Loss Through the Combustion Chamber Walls
It is generally assumed that an insulating wall reduces heat losses from the combustion chamber of a cook stove. Three broad classes of materials are being considered for stove construction. These are air-dried clay, ceramics, and metal. According to general belief, the metal stoves will lose too much heat and thus can be expected to provide poorer performance than clay stoves. We shall provide in this section a few quantitative results obtained by Krishna Prasad and Bussmann (1983) to show that such a belief is misplaced.
The stove model used in the calculation mentioned above was that of a square cavity with a pan at the top and fuel bed at the bottom (see Fig.6.1). The complex heat liberation from the real fire is replaced by a symmetric heat source. The corner effects as well as finite height of the cavity are ignored in the model. Thus the problem reduces to unsteady, one-dimensional heat conduction in a slab subjected to convective boundary conditions (the radiative heat flux on the wall is accounted for by introducing a fictitious heat transfer coefficient). The governing equations are solved by the integral techniques (Ozisik 1980). The solution is constructed in two phases:
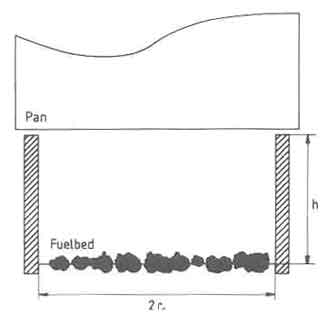
Fig.1.The stove Model Used for the Calculations of the Stove Wall Temperatures
The procedure requires the assumption of temperature profiles. Quadratic profiles were used in the study and the coefficients were evaluated using the boundary conditions. The procedure leads to two ordinary differential equations for the penetration thickness in the first phase and the inner skin temperature T1 in the second phase. The equation and the solution for the first phase are as follows:
 (1)
(1)
with
where ![]() is the thermal diffusivity in m2/sec, and hg is the gas-side
heat transfer coefficient in W/m2K.
The rest of the symbols have been defined earlier.
The solution is given implicitly as
is the thermal diffusivity in m2/sec, and hg is the gas-side
heat transfer coefficient in W/m2K.
The rest of the symbols have been defined earlier.
The solution is given implicitly as
 (2)
(2)

![]()
![]()
![]() (4)
(4)


and
L* in the above equations is the slab thickness and ha is the air-side heat transfer coefficient. The solution for Eqs. (6.3) and (6.4) is
where
 (6)
(6)
To evaluate these, we need to know
Tg,
hg,
ha,
L*,
and the material properties
![]() and
and
![]() .
Barring L*, all other quantities are not known with any degree
of reliability. The greatest of these uncertainties is associated with
Tg and hg.
The main problem here is in connection with the treatment of the flow in the
cavity. The flow can be laminar or turbulent. The second choice is about the
type of solution to be used: flow in a square duct with thermally and
hydrodynamically developing flow, or boundary-layer flow over the wall with
varying free stream velocity and temperature. The hot combustion gases do
not fill the entire cavity and this brings additional complications. Some
crude estimates by Krishna Prasad and Bussmann indicate that hg
using a boundary-layer type of approximation and estimating the radiant transfer
in a manner similar to what was done in the previous section was 30
W/m2K for a cavity with a 12.5-cm side and 12.5-cm height.
.
Barring L*, all other quantities are not known with any degree
of reliability. The greatest of these uncertainties is associated with
Tg and hg.
The main problem here is in connection with the treatment of the flow in the
cavity. The flow can be laminar or turbulent. The second choice is about the
type of solution to be used: flow in a square duct with thermally and
hydrodynamically developing flow, or boundary-layer flow over the wall with
varying free stream velocity and temperature. The hot combustion gases do
not fill the entire cavity and this brings additional complications. Some
crude estimates by Krishna Prasad and Bussmann indicate that hg
using a boundary-layer type of approximation and estimating the radiant transfer
in a manner similar to what was done in the previous section was 30
W/m2K for a cavity with a 12.5-cm side and 12.5-cm height.
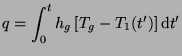
The main purpose here is to determine the relative heat transfer performance of three materials commonly used for construction of stoves - air-dried clay, ceramic, and metal. Figure 6.2 shows the increase of inner skin temperature with time. The parameters used in the calculations are shown as an inset in the diagram. These temperature histories show nothing special. The steady-state times are of the order of 20 and 60 min for metal and ceramic stoves respectively. The clay stove does not reach the steady state in the calculation period.

The wall temperature with time for ceramic, clay and metal stove walls
The heat flow results for the three materials are shown in Table 1. The ceramic stove performs the best for the parameter set chosen here. The clay stove starts scoring over the metal stove after nearly 2 hours of operation. Thus the assumption that a metal stove performs poorly compared to a clay stove is not substantiated by the results for normal cooking tasks.
Because of the uncertainties involved in the determination of hg, we show its influence on the heat flows for the three materials in Table 1. Lower heat transfer coefficients improve the performance of the metal stoves with respect to the other two. On the other hand variation of Tg has much stronger influence, as the results in Table 1 (for metal stoves) show. Finally, varying the wall thickness for a clay stove has very little influence on the heat flow through the inner skin.
The main use of the work as it stands now is to obtain the relative estimates of heat losses of different classes of stove materials. The penalty paid by a metal stove at least from heat loss point of view is not large enough to discredit its use. Thus the choice of air-dried clay stove is dictated by perceived economic advantages. We have our doubts about this advantage! The ceramic stove holds the greatest promise from many points of view.
In the next section we will present some experimental results that will help in putting this work in appropriate perspective.
| Effect of period of operationb | ||||
| Time(hours) | ||||
| Material | 1/2 | 1 | 2 | |
| Metal | 15.2 | 29.3 | 57.6 | |
| Ceramic | 14.6 | 23.6 | 41.2 | |
| Clay | 19.7 | 33.2 | 54.7 | |
| Effect of hg on heat flowc | ||||
| hg W/m2K |
material | Time(hours) | ||
| 1/2 | 1 | 2 | ||
| Metal | 10.7 | 20.3 | 397 | |
| 15 | Ceramic | 10.7 | 18.2 | 32.0 |
| Clay | 13.0 | 23.3 | 40.5 | |
| Metal | 17.6 | 34.7 | 68.9 | |
| 45 | Ceramic | 16.5 | 26.5 | 45.5 |
| Clay | 23.5 | 38.9 | 61.6 | |
| Effect of Tg on heat flowd | ||||
| Tg (K) |
Time(hours) | |||
| 1/2 | 1 | 2 | ||
| 700 | 7.32 | 4.1 | 27.6 | |
| 800 | 9.67 | 8.7 | 36.8 | |
| 900 | 12.2 | 23.7 | 46.7 | |
| 1000 | 14.9 | 29.0 | 57.3 | |
b See Fig.6.2 for parameter values
c Other parameters as in Fig.6.2
d Material assessed was metal; L = 0.0015 m;
hg = 30 W/m2 K.
Radiant Heat Gain by the Pan due to the Presence of Walls
The stove literature (Delepeleire et al. 1981) suggests that the presence of walls improves the radiant heat input to the pan. In this section we shall look at the extent of improvement that can be expected due to this source. A purely theoretical approach is far too involved to be of any significant use. We thus use some experimental results obtained by Delsing (1981) to arrive at estimates of this heat gain. These experiments were carried out in a tall, cylindrical combustion chamber with provisions to change the vertical position of the grate and to make a number of temperature measurements (see Fig.6.3). Table 2 summarizes a few basic test results obtained with the system for varying distances between the fuel bed top and the pan bottom. The table also summarizes the experimental conditions.
Figure 6.4 shows a few temperature time histories. These histories are
typically oscillating, as is to be expected from the fuel bed weight-loss
curves shown for the open fire in the previous section.
| Sl. No. |
Distance from fuel bed top to pan bottom (cm) |
A3/A1 | T3 (K) |
F1,2 | Efficiency (%) |
| 1. | 26 | 10.4 | 723 | 0.149 | 25.9 |
| 2. | 23 | 9.2 | 733 | 0.184 | 26.6 |
| 3. | 16 | 6.4 | 743 | 0.321 | 31.6 |
| 4. | 13 | 5.2 | 753 | 0.418 | 31.8 |
A1, Area of the grate;
A3, area of the wall;
T3, average wall temperature;
F1,2, configuration factor between fuel bed top and pan bottom.
Power level of the fire: 3.12 kW; operation of
the stove by charging 50 g at 5-min intervals.
Wood: white fir prepared in blocks of 12 x 19 x 50 mm
and oven dried. Aluminum pan of 28-cm diameter, 24-cm
height, with 5 kg water.
The larger oscillations in the gas stream and rather lower level of oscillations in the wall temperatures are also to be expected. Delsing did not make any corrections for conduction and radiation errors in his temperature measurements, and thus these again represent trends rather than real values.
Table 3 shows the fuel bed characteristics calculated for the experiments indicated in Table 2. The energy balance for the fuel bed indicated in the previous section is modified to account for the presence of walls.
 (7)
(7)
where Ta= 300K.
![]() is evaluated with the same assumptions used in the open fire calculations.
Once F1,2 is calculated, all the other F
values can be obtained by the application of reciprocity and enclosure rules
(Sparrow and Cess, 1970). All the surfaces of the enclosure are assumed
is evaluated with the same assumptions used in the open fire calculations.
Once F1,2 is calculated, all the other F
values can be obtained by the application of reciprocity and enclosure rules
(Sparrow and Cess, 1970). All the surfaces of the enclosure are assumed
![]() requires some assumption about the excess-air factor. No
gas analysis was performed and as such this cannot be obtained by
experiment. The stove was designed to operate with the draft created by the
combustion chamber (which was unduly tall), and the design value of the
excess-air factor was 1.4, which, on operational experience, was changed to
2.2. in the cylindrical stove.
requires some assumption about the excess-air factor. No
gas analysis was performed and as such this cannot be obtained by
experiment. The stove was designed to operate with the draft created by the
combustion chamber (which was unduly tall), and the design value of the
excess-air factor was 1.4, which, on operational experience, was changed to
2.2. in the cylindrical stove.
When the height of the combustion chamber was varied as in the experiments of Table 2, the draft changed and accordingly the air intake. The mass flows through the stove were corrected to take this into account according to
| Sl. No. |
Heighta (cm) |
Gas flow (kg/s) x 10 6 |
Temperature (K) |
(W) |
(W) |
| 1. | 26 | 879 | 992 | 407 | 693 |
| 2. | 23 | 826 | 1008 | 428 | 672 |
| 3. | 16 | 689 | 1055 | 500 | 600 |
| 4. | 13 | 621 | 1080 | 542 | 558 |
b
c
The gas flow changes by about 30% due to the change in configuration. For
this configuration the combustion gases carry away much more heat than the
radiant heat output from the bed, except for the case where h = 13 cm.
The heat transfer results are shown in Table 4.
![]() was obtained from
was obtained from
| Sl. No. |
Height (cm) |
(W) |
(W) |
(W) |
(W) |
(W) |
| 1. | 26 | 63 | 96 | 159 | 646 | 1779 |
| 2. | 23 | 83 | 98 | 181 | 649 | 1547 |
| 3. | 16 | 174 | 86 | 260 | 725 | 799 |
| 4. | 13 | 249 | 78 | 327 | 667 | 509 |
a
b
c
d
![]() was inferred from the efficiency measurements and
was inferred from the efficiency measurements and
![]() was calculated by
was calculated by
 (10)
(10)
Several factors emerge from an examination of these results. The radiant contribution to the pan increases from about one-fifth to one-third of the total heat input to the pan as the distance between the pan bottom and fuel bed increases. The wall itself provides about 7.5 to 12% of the heat to the pan. In general, the wall heat loss in a closed stove is strongly governed by the area ratio of the pan surface and the wall surface. The function of a good design is to maximize this ratio without sacrificing combustion quality. Under these conditions, the contribution of radiant heat transfer to the pan from the walls will be of marginal importance.